Financial Review
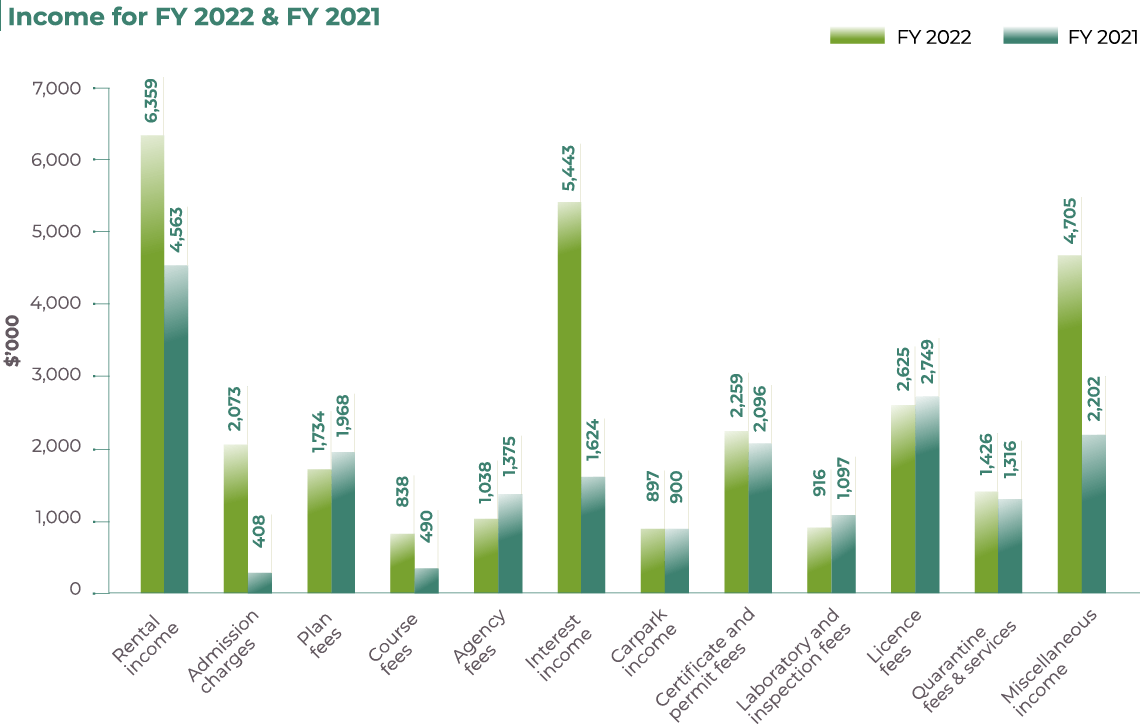
Income
The Group's income comprised mainly rental income from souvenir kiosks and food & beverage outlets in Singapore Botanic Gardens and Fort Canning Park. The income for the year was $30.3 million. The increase from last year's income was mainly due to increase in rental income, admission fees, interest income and other income.
| FY 2022 | FY 2021 | INCREASE/(DECREASE) | ||
|---|---|---|---|---|
| Income | $ '000 | $ '000 | $ '000 | %Change |
| Rental income | 6,359 | 4,563 | 1,796 | 39 |
| Admission charges | 2,073 | 408 | 1,665 | > 100 |
| Plan fees | 1,734 | 1,968 | (234) | (12) |
| Course fees | 838 | 490 | 348 | 71 |
| Agency fees | 1,038 | 1,375 | (337) | (25) |
| Interest income | 5,443 | 1,624 | 3,819 | 235 |
| Carpark income | 897 | 900 | (3) | < 1 |
| Certificate and permit fees | 2,259 | 2,096 | 163 | 8 |
| Laboratory and inspection fees | 916 | 1,097 | (181) | (16) |
| Licence fees | 2,625 | 2,749 | (124) | (5) |
| Quarantine fees and services | 1,426 | 1,316 | 110 | 8 |
| Miscellaneous income | 4,705 | 2,202 | 2,503 | 114 |
| 30,313 | 20,788 | 9,525 | 46 | |
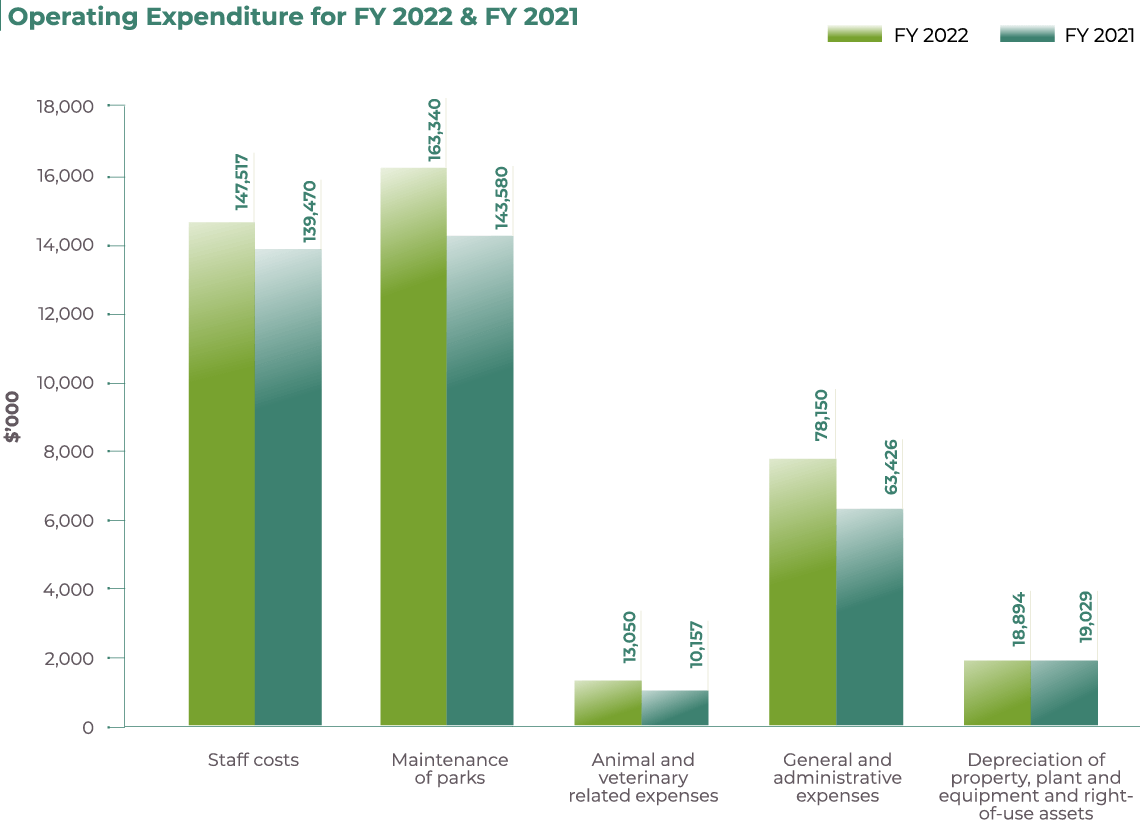
Operating Expenditure
The Group's operating expenditure for the year was $420.9 million. The 12% increase from last year's expenditure was due to the increase in staff costs, maintenance of parks, animal and veterinary related expenses and general and administrative expenses.
| FY 2022 | FY 2021 | INCREASE/(DECREASE) | ||
|---|---|---|---|---|
| Operating Expenditure | $ '000 | $ '000 | $ '000 | %Change |
| Staff costs | 147,517 | 139,470 | 8,047 | 6 |
| Maintenance of parks | 163,340 | 143,580 | 19,760 | 14 |
| Animal and veterinary related expenses | 13,050 | 10,157 | 2,893 | 28 |
| General and administrative expenses | 78,150 | 63,426 | 14,724 | 23 |
| Depreciation of property, plant and equipment and right-of-use assets | 18,894 | 19,029 | (135) | (1) |
| 420,951 | 375,662 | 45,289 | 12 | |
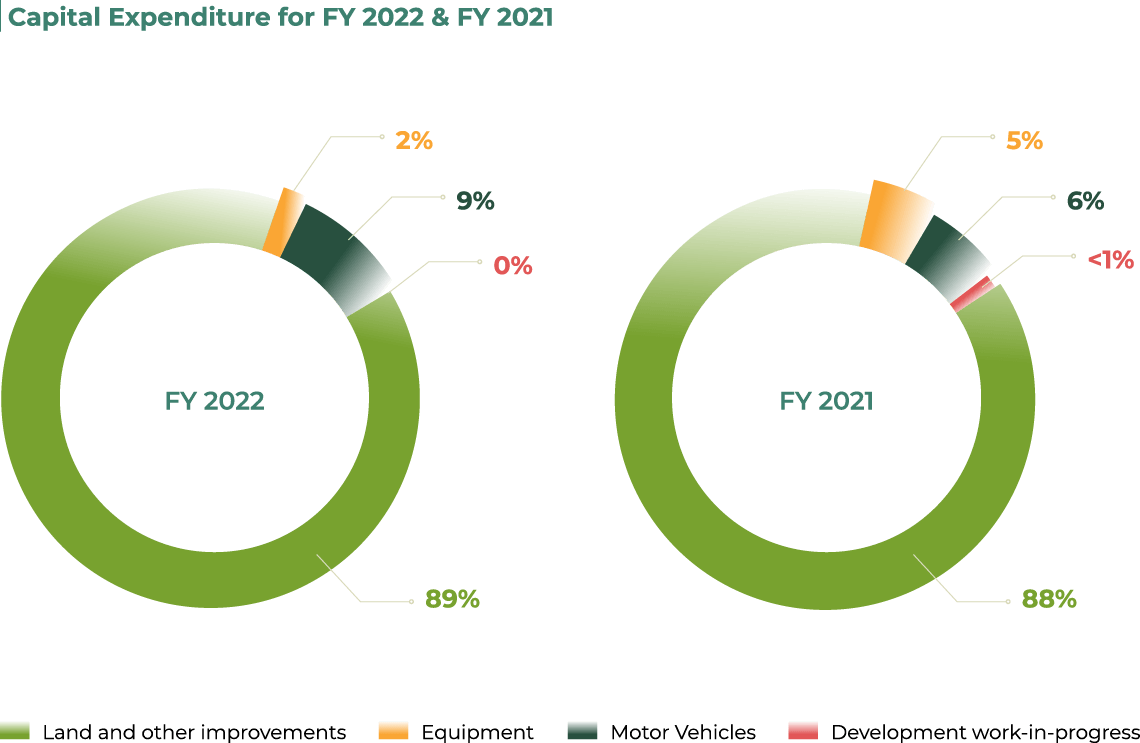
Capital Expenditure
The Group's capital expenditure for the year was $14.3 million. The decrease in capital expenditure was mainly due to the completion of most of construction works at Native Plant Nursery and Animal Quarantine Centre in FY2021.
| FY 2022 | FY 2021 | INCREASE/(DECREASE) | ||
|---|---|---|---|---|
| Capital Expenditure | $ '000 | $ '000 | $ '000 | %Change |
| Land and other improvements | 246 | 1,227 | (981) | (80) |
| Equipment | 1,309 | 1,255 | 54 | 4 |
| Motor Vehicles | - | 117 | (117) | (100) |
| Development work-in-progress | 12,731 | 19,867 | (7,136) | (36) |
| 14,286 | 22,466 | (8,180) | (36) | |
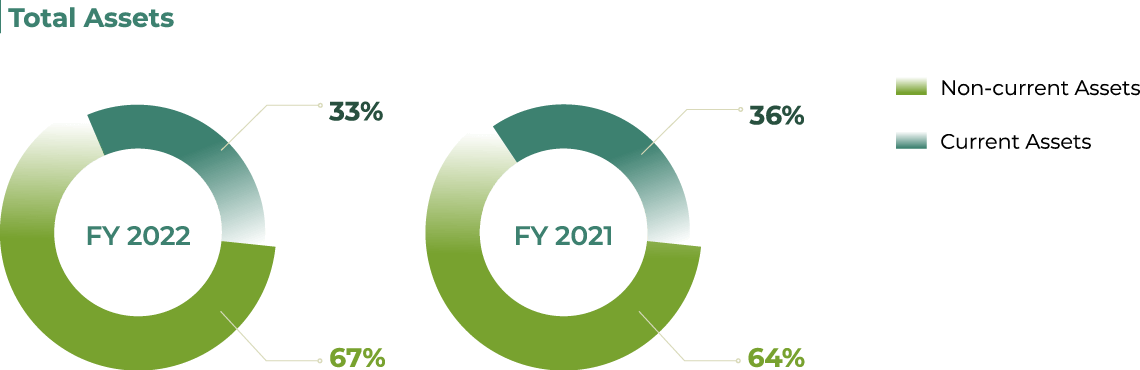
Financial Position
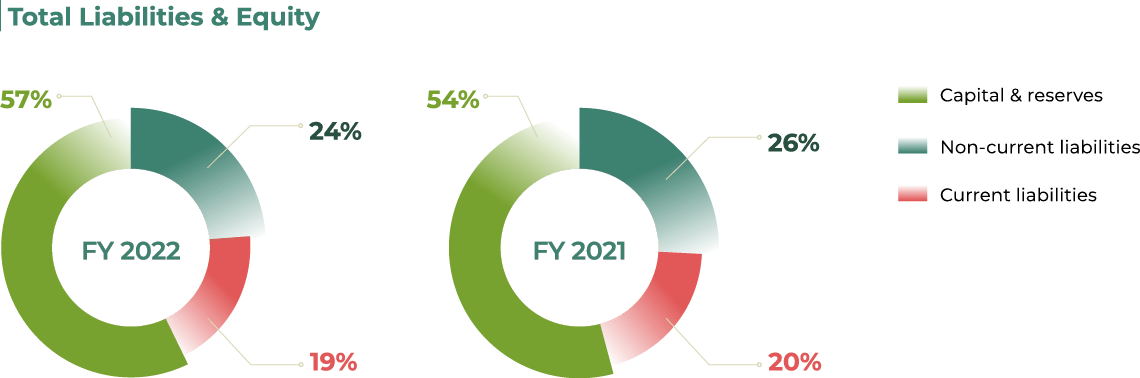
As at 31 March 2023, the Group's total assets stood at $629.4 milion, an increase of 5% over last year. Non-current assets and current assets represent 33% and 67% of total assets respectively. Non-current assets consisted mainly of leasehold land and buildings and structures at Singapore Botanic Gardens and Fort Canning Park as well as the structures at Animal & Plant Health Centre, Animal Quarantine Centre and Animal Management Centre. Capital and reserve stood at $362.1 million, while non-current liabilities and current liabilities stood at $149.7 million and $117.6 million respectively.
| FY 2022 | FY 2021 | INCREASE/(DECREASE) | ||
|---|---|---|---|---|
| Assets | $ '000 | $ '000 | $ '000 | %Change |
| Non-current assets | 209,211 | 214,216 | (5,005) | (2) |
| Current assets | 420,173 | 385,246 | 34,927 | 9 |
| 629,384 | 599,462 | 29,922 | 5 | |
| FY 2022 | FY 2021 | INCREASE/(DECREASE) | ||
|---|---|---|---|---|
| EQUITY & LIABILITIES | $ '000 | $ '000 | $ '000 | %Change |
| Capital & reserves | 362,074 | 323,719 | 38,355 | 12 |
| Non-current liabilities | 149,687 | 158,025 | (8,338) | (5) |
| Current liabilities | 117,623 | 117,717 | (94) | < 1 |
| 629,384 | 599,461 | 29,923 | 5 | |