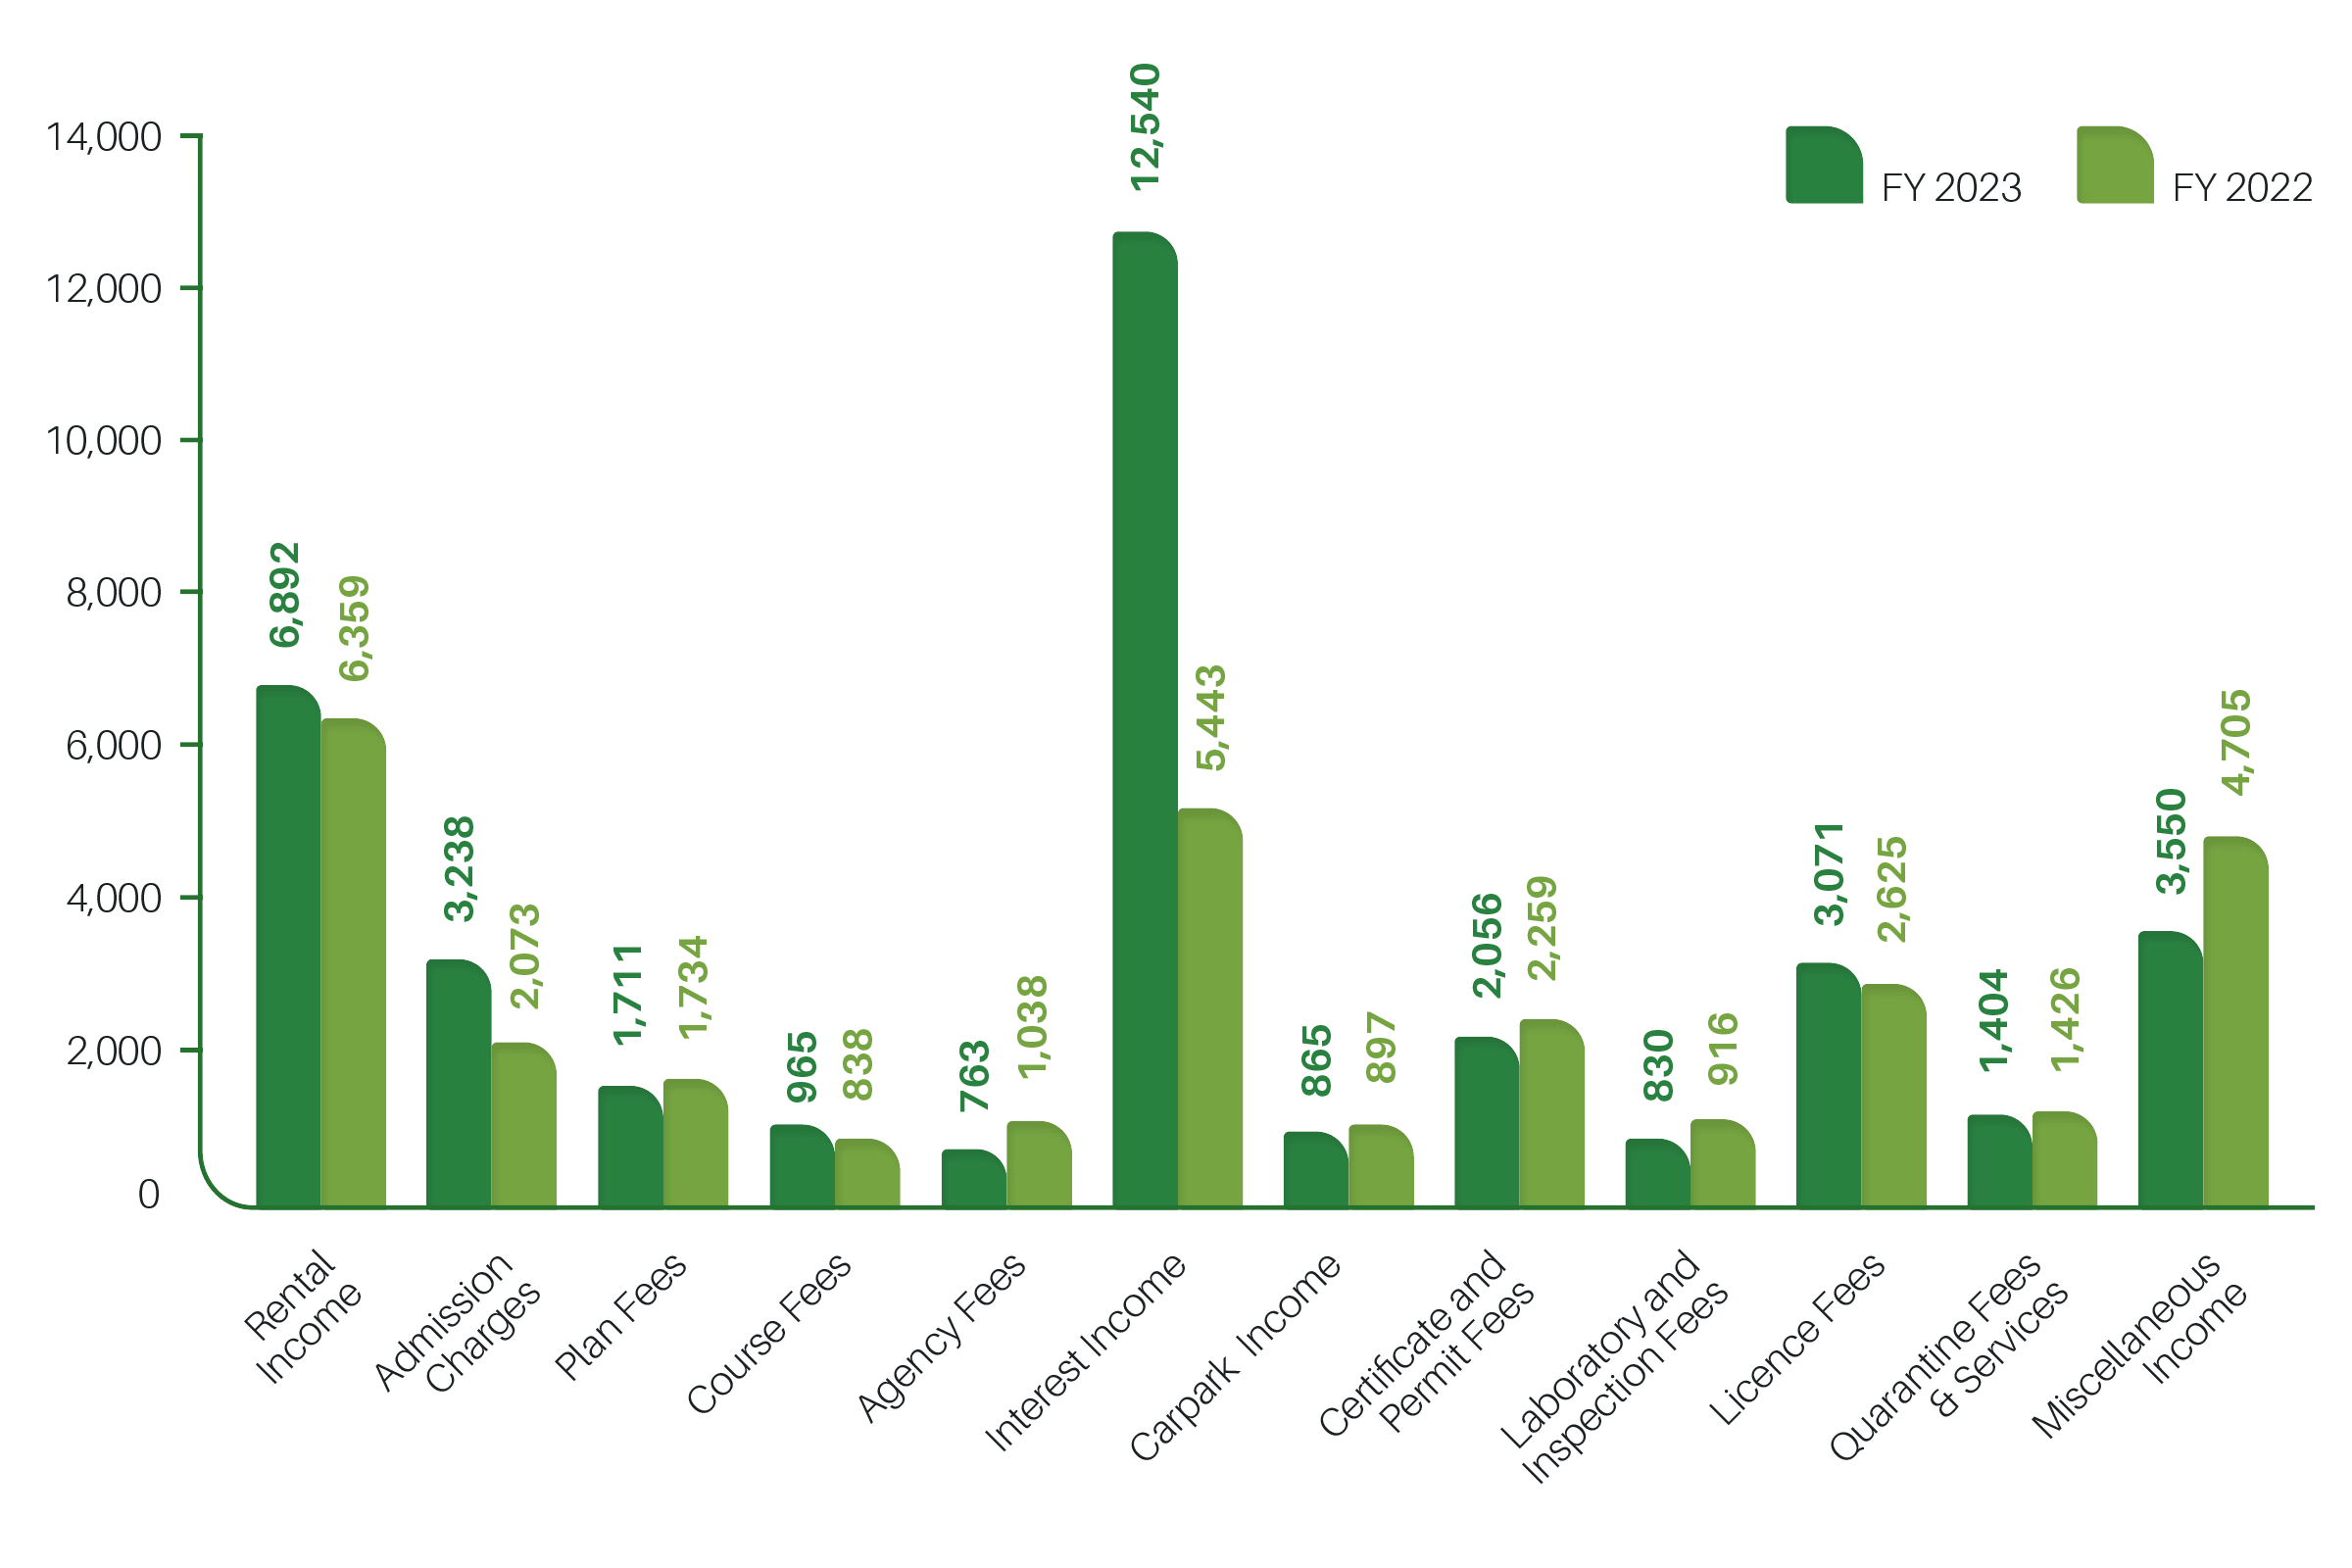
The Group's income comprised mainly interest income, rental income from souvenir kiosks and F&B outlets in Singapore Botanic Gardens and Fort Canning Park, admission charges and licence fees. The income for the year was $37.9 million. The increase from last year's income was mainly due to an increase in interest income.
| FY 2023 | FY 2022 | INCREASE/(DECREASE) | ||
|---|---|---|---|---|
| Income | $ '000 | $ '000 | $ '000 | %Change |
| Rental income | 6,892 | 6,359 | 533 | 8 |
| Admission charges | 3,238 | 2,073 | 1,165 | 56 |
| Plan fees | 1,711 | 1,734 | (23) | (1) |
| Course fees | 965 | 838 | 127 | 15 |
| Agency fees | 763 | 1,038 | (275) | (26) |
| Interest income | 12,540 | 5,443 | 7,097 | > 100 |
| Carpark income | 865 | 897 | (32) | (4) |
| Certificate and permit fees | 2,056 | 2,259 | (203) | (9) |
| Laboratory and inspection fees | 830 | 916 | (86) | (9) |
| Licence fees | 3,071 | 2,625 | 446 | 17 |
| Quarantine fees and services | 1,404 | 1,426 | (22) | (2) |
| Miscellaneous income | 3,550 | 4,705 | (1,155) | (25) |
| 37,885 | 30,313 | 7,572 | 25 | |
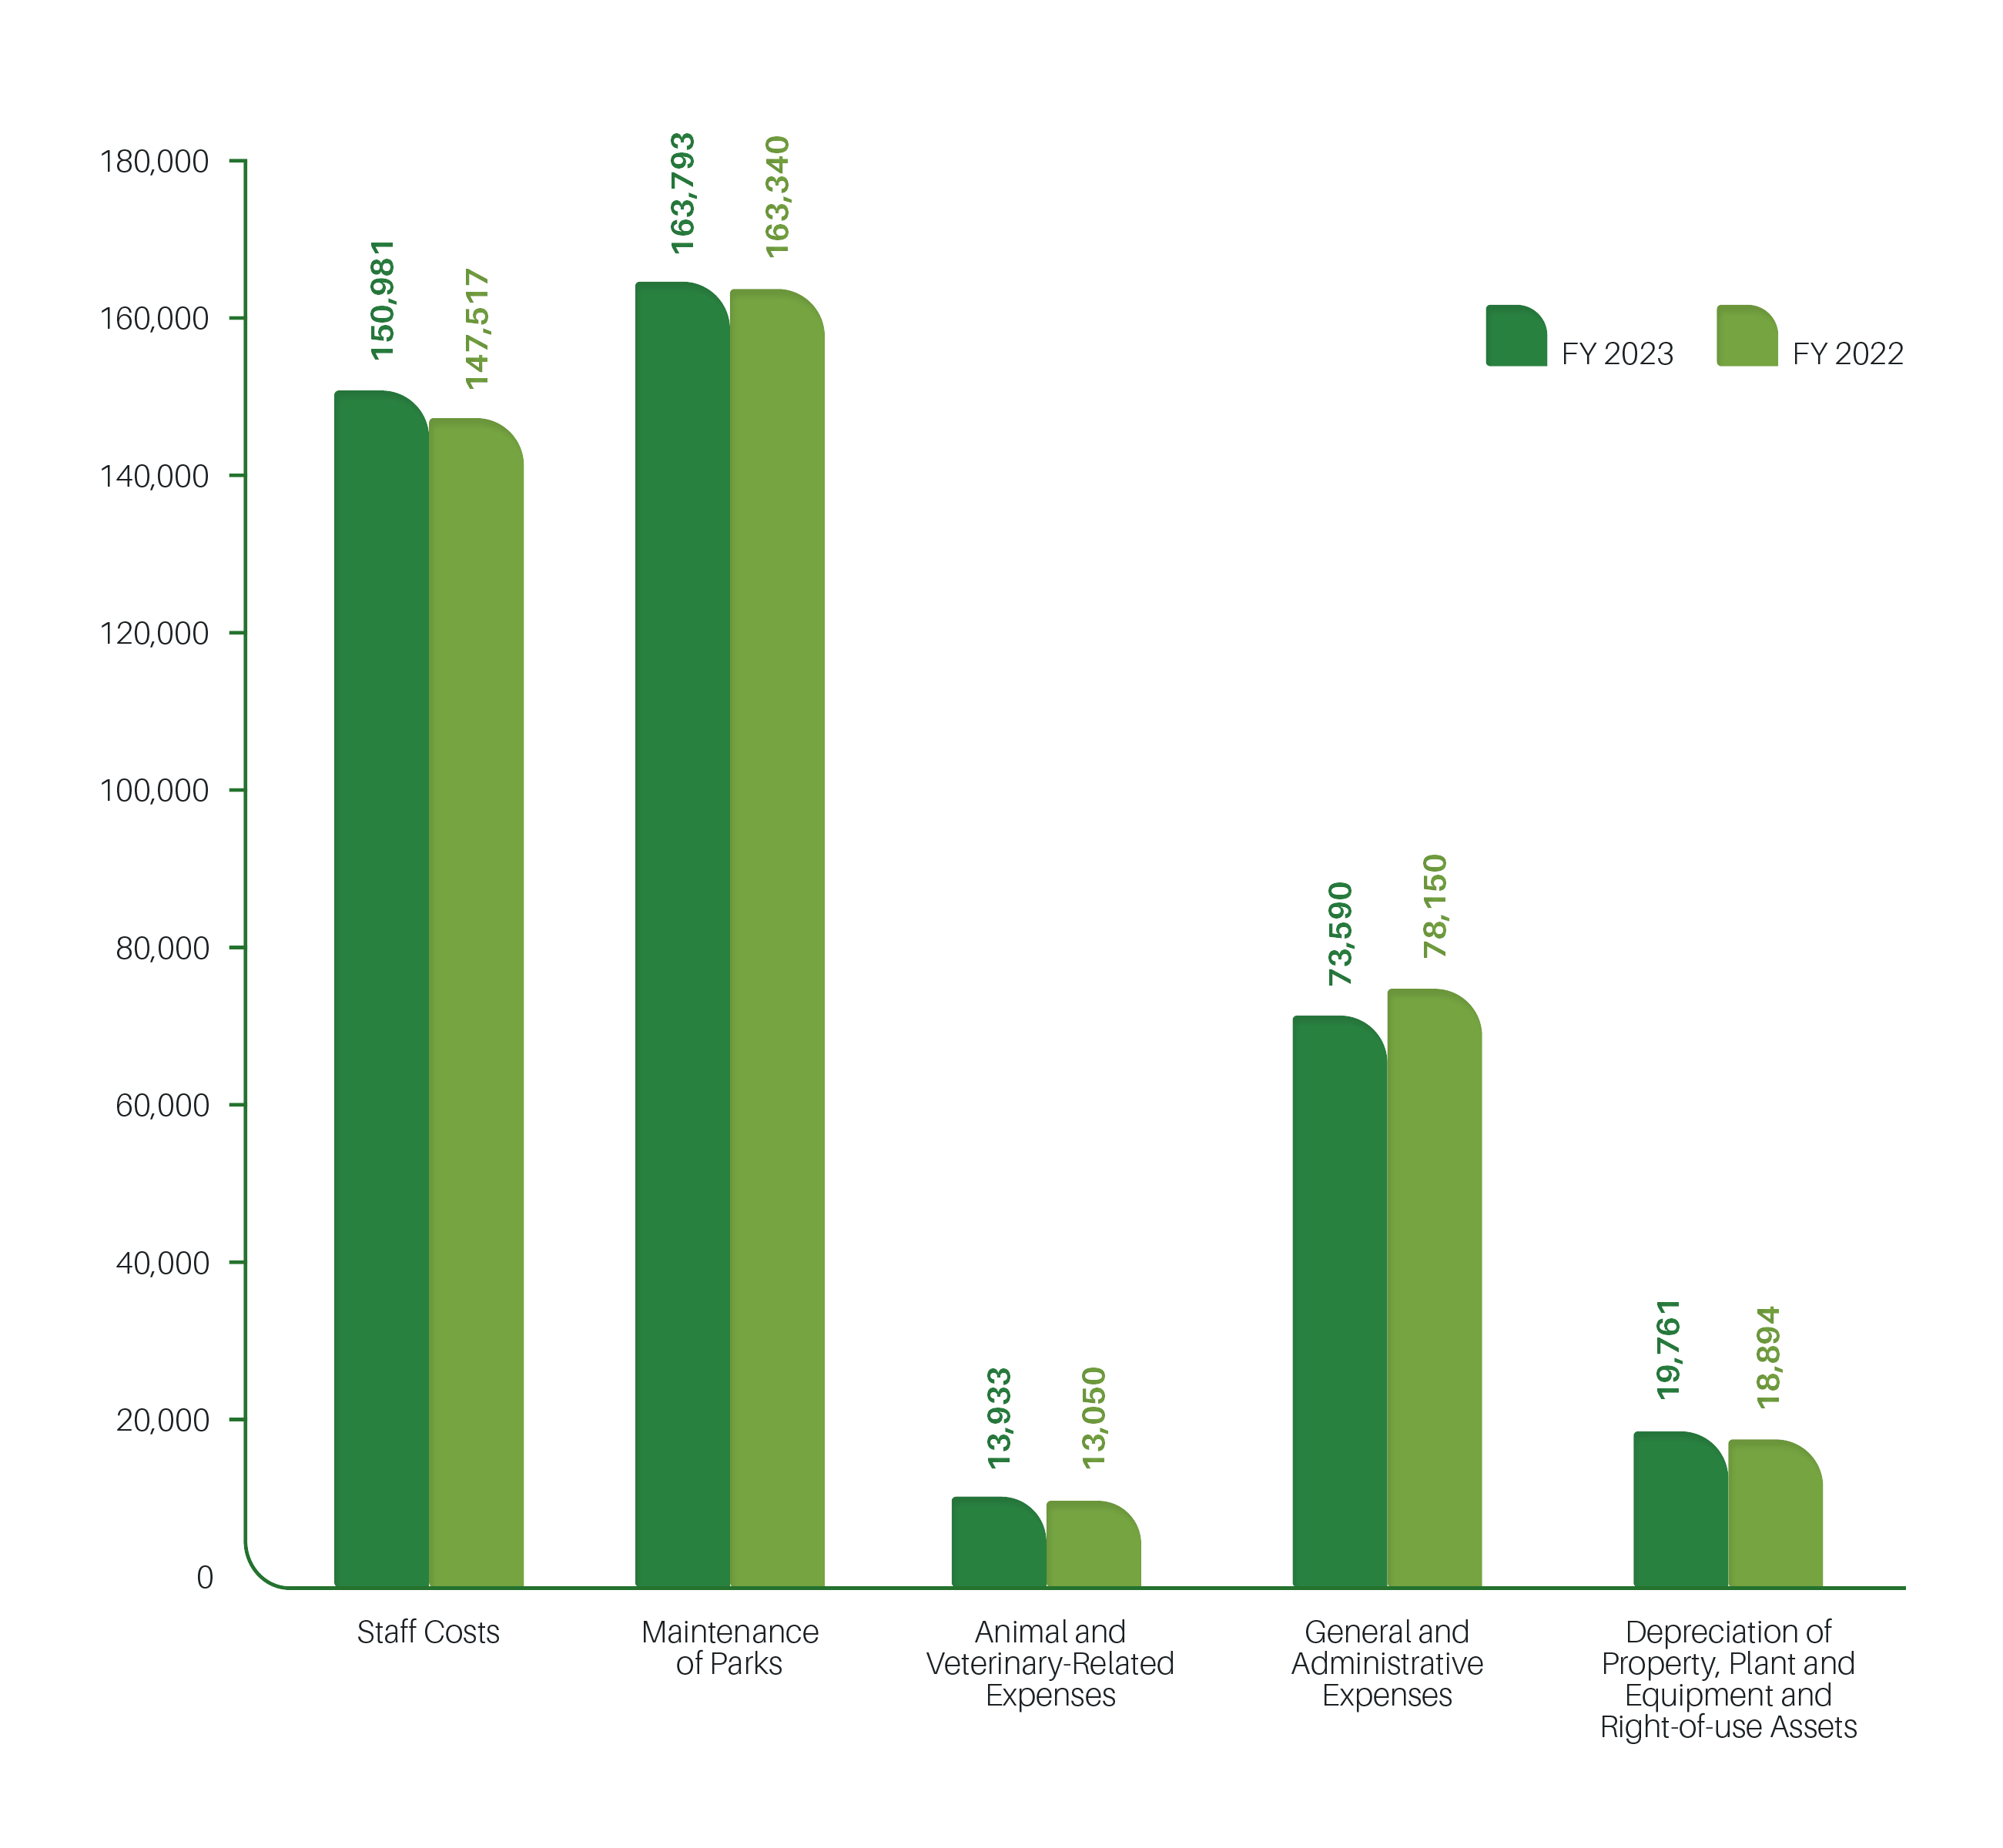
The Group's operating expenditure for the year was $422.06 million, which is <1% higher compared to last year's operating expenditure of $420.95 million. The slight increase was due to an increase in staff cost, maintenance of parks, animal and veterinary-related expenses and depreciation costs, offset by a decrease in general and administrative expenses.
| FY 2023 | FY 2022 | INCREASE/(DECREASE) | ||
|---|---|---|---|---|
| operating expenditure | $ '000 | $ '000 | $ '000 | %Change |
| Staff Costs | 150,981 | 147,517 | 3,464 | 2 |
| Maintenance of Parks | 163,793 | 163,340 | 453 | < 1 |
| Animal and Veterinary-Related Expenses | 13,933 | 13,050 | 883 | 7 |
| General and Administrative Expenses | 73,590 | 78,150 | (4,560) | (6) |
| Depreciation of Property, Plant and Equipment and Right-of-use Assets | 19,761 | 18,894 | 867 | 5 |
| 422,058 | 420,951 | 1,106 | < 1 | |
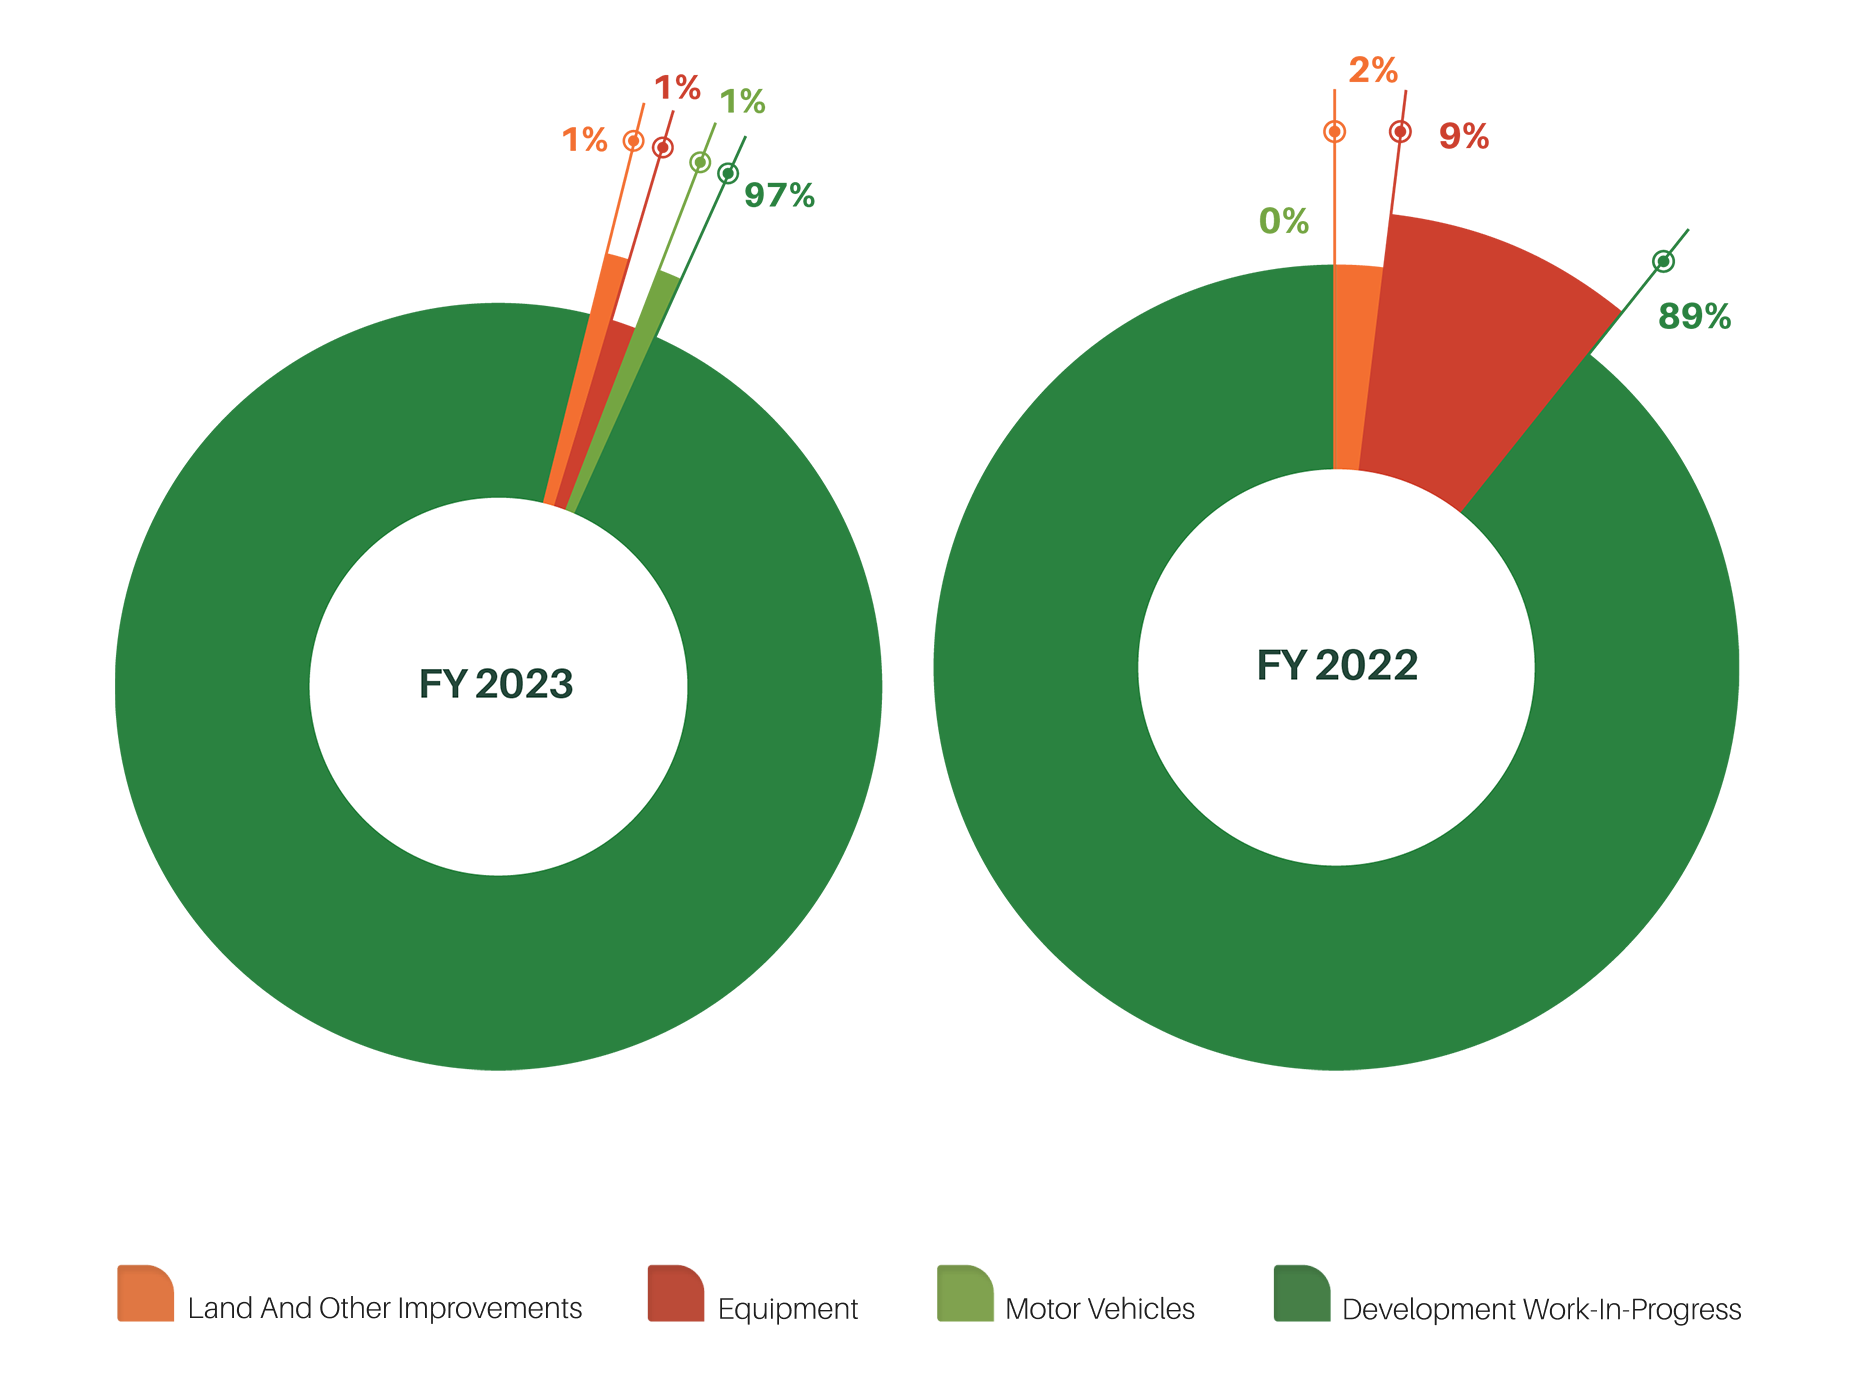
The Group's capital expenditure for the year was $11.8 million. The decrease in capital expenditure was mainly due to higher purchases of equipment and development work-in-progress in FY2022.
| FY 2023 | FY 2022 | INCREASE/(DECREASE) | ||
|---|---|---|---|---|
| capital expenditure | $ '000 | $ '000 | $ '000 | %Change |
| Land and Other Improvements | 156 | 246 | (90) | (37) |
| Equipment | 151 | 1,309 | (1,158) | (88) |
| Motor Vehicles | 177 | 0 | 177 | 100 |
| Development Work-in-Progress | 11,312 | 12,731 | (1,419) | (11) |
| 11,796 | 14,286 | 2,490 | (17) | |
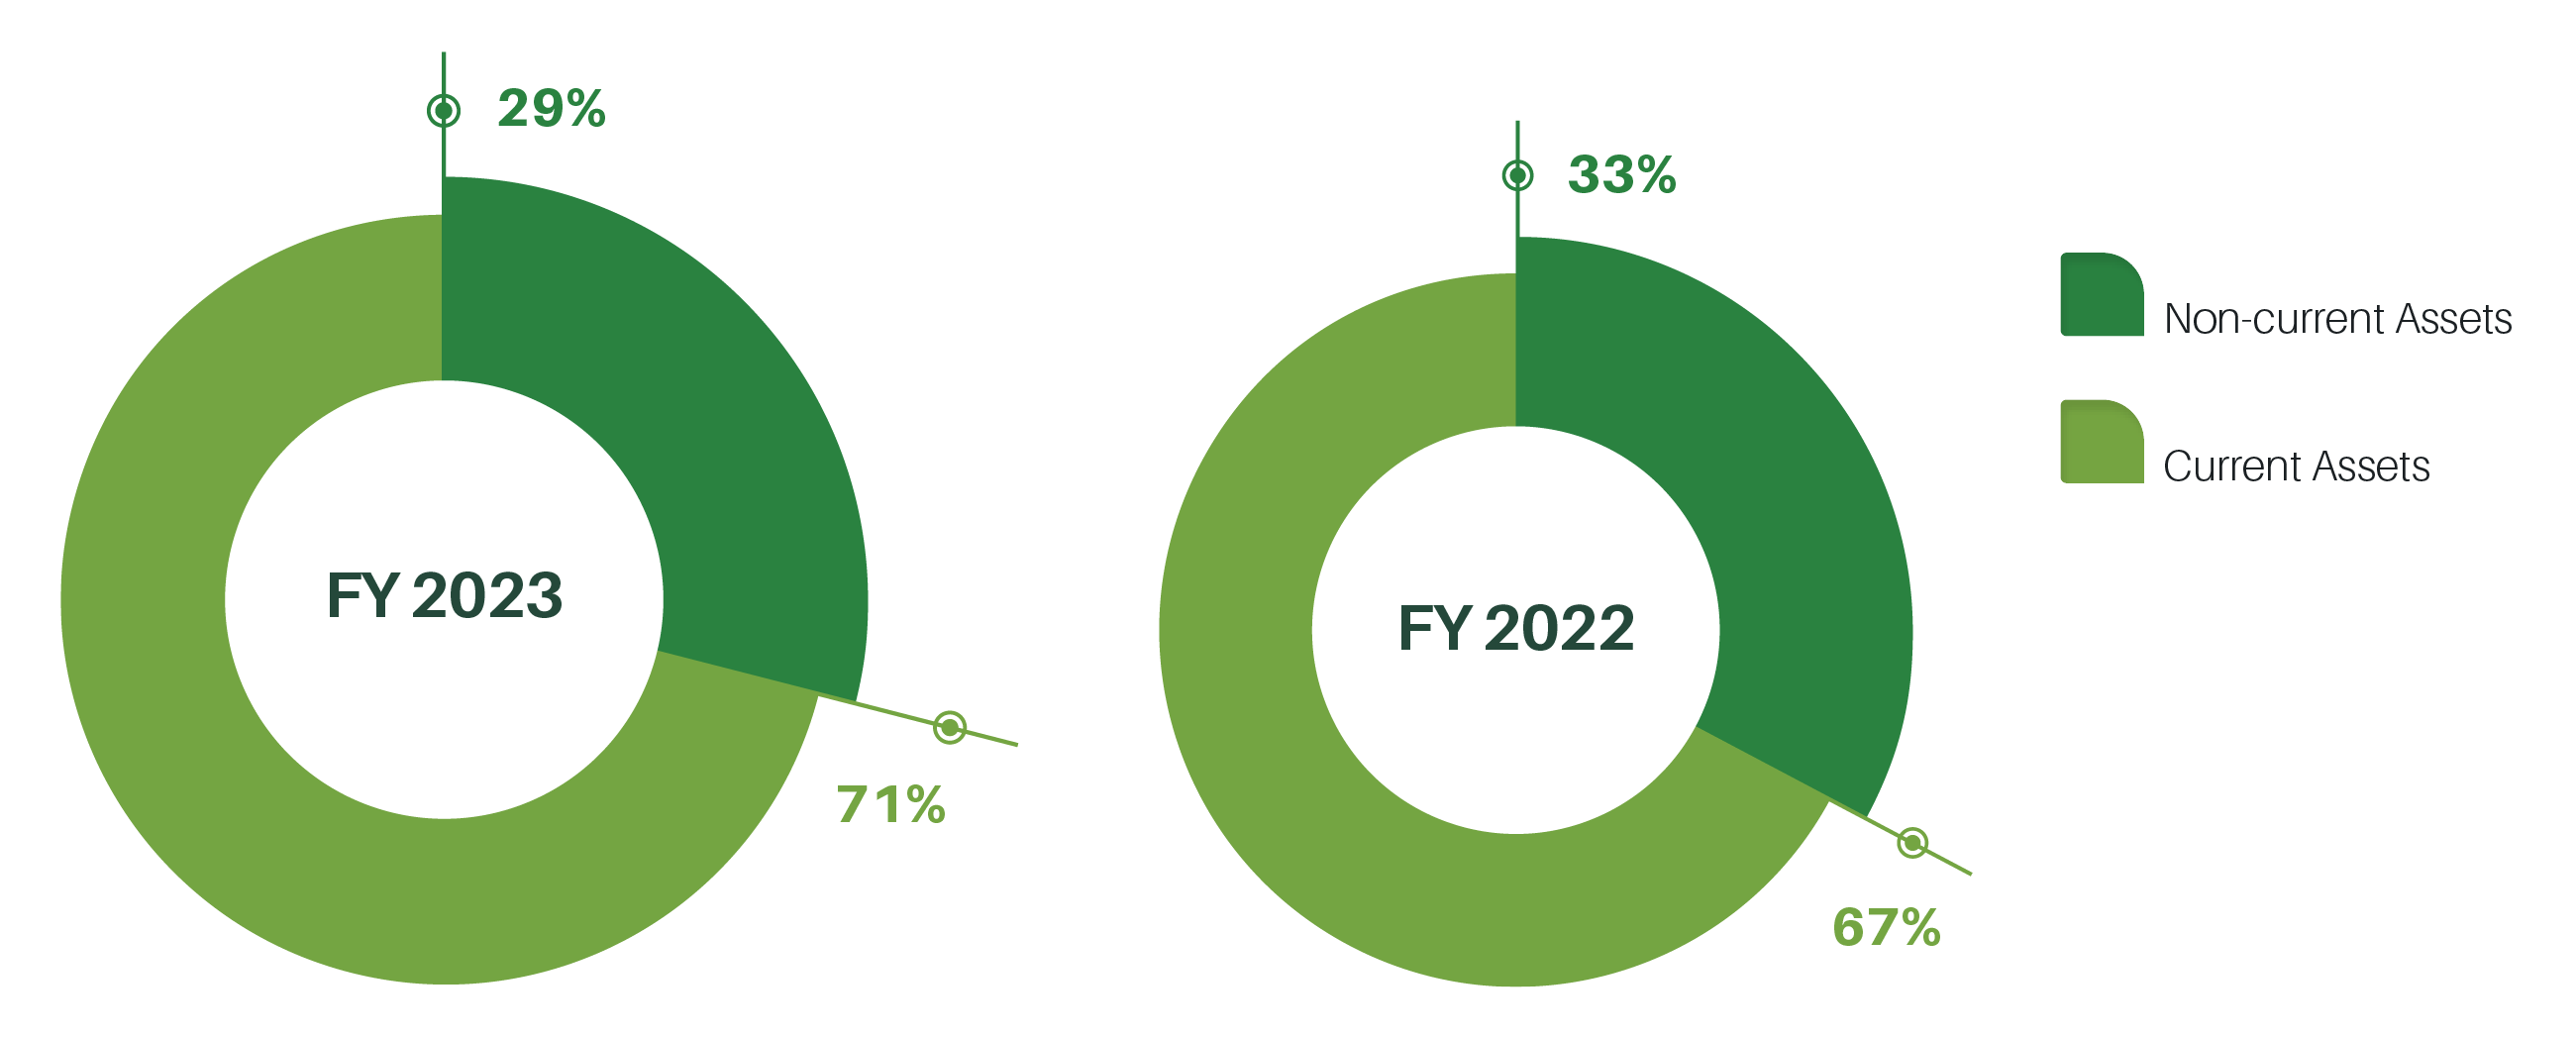
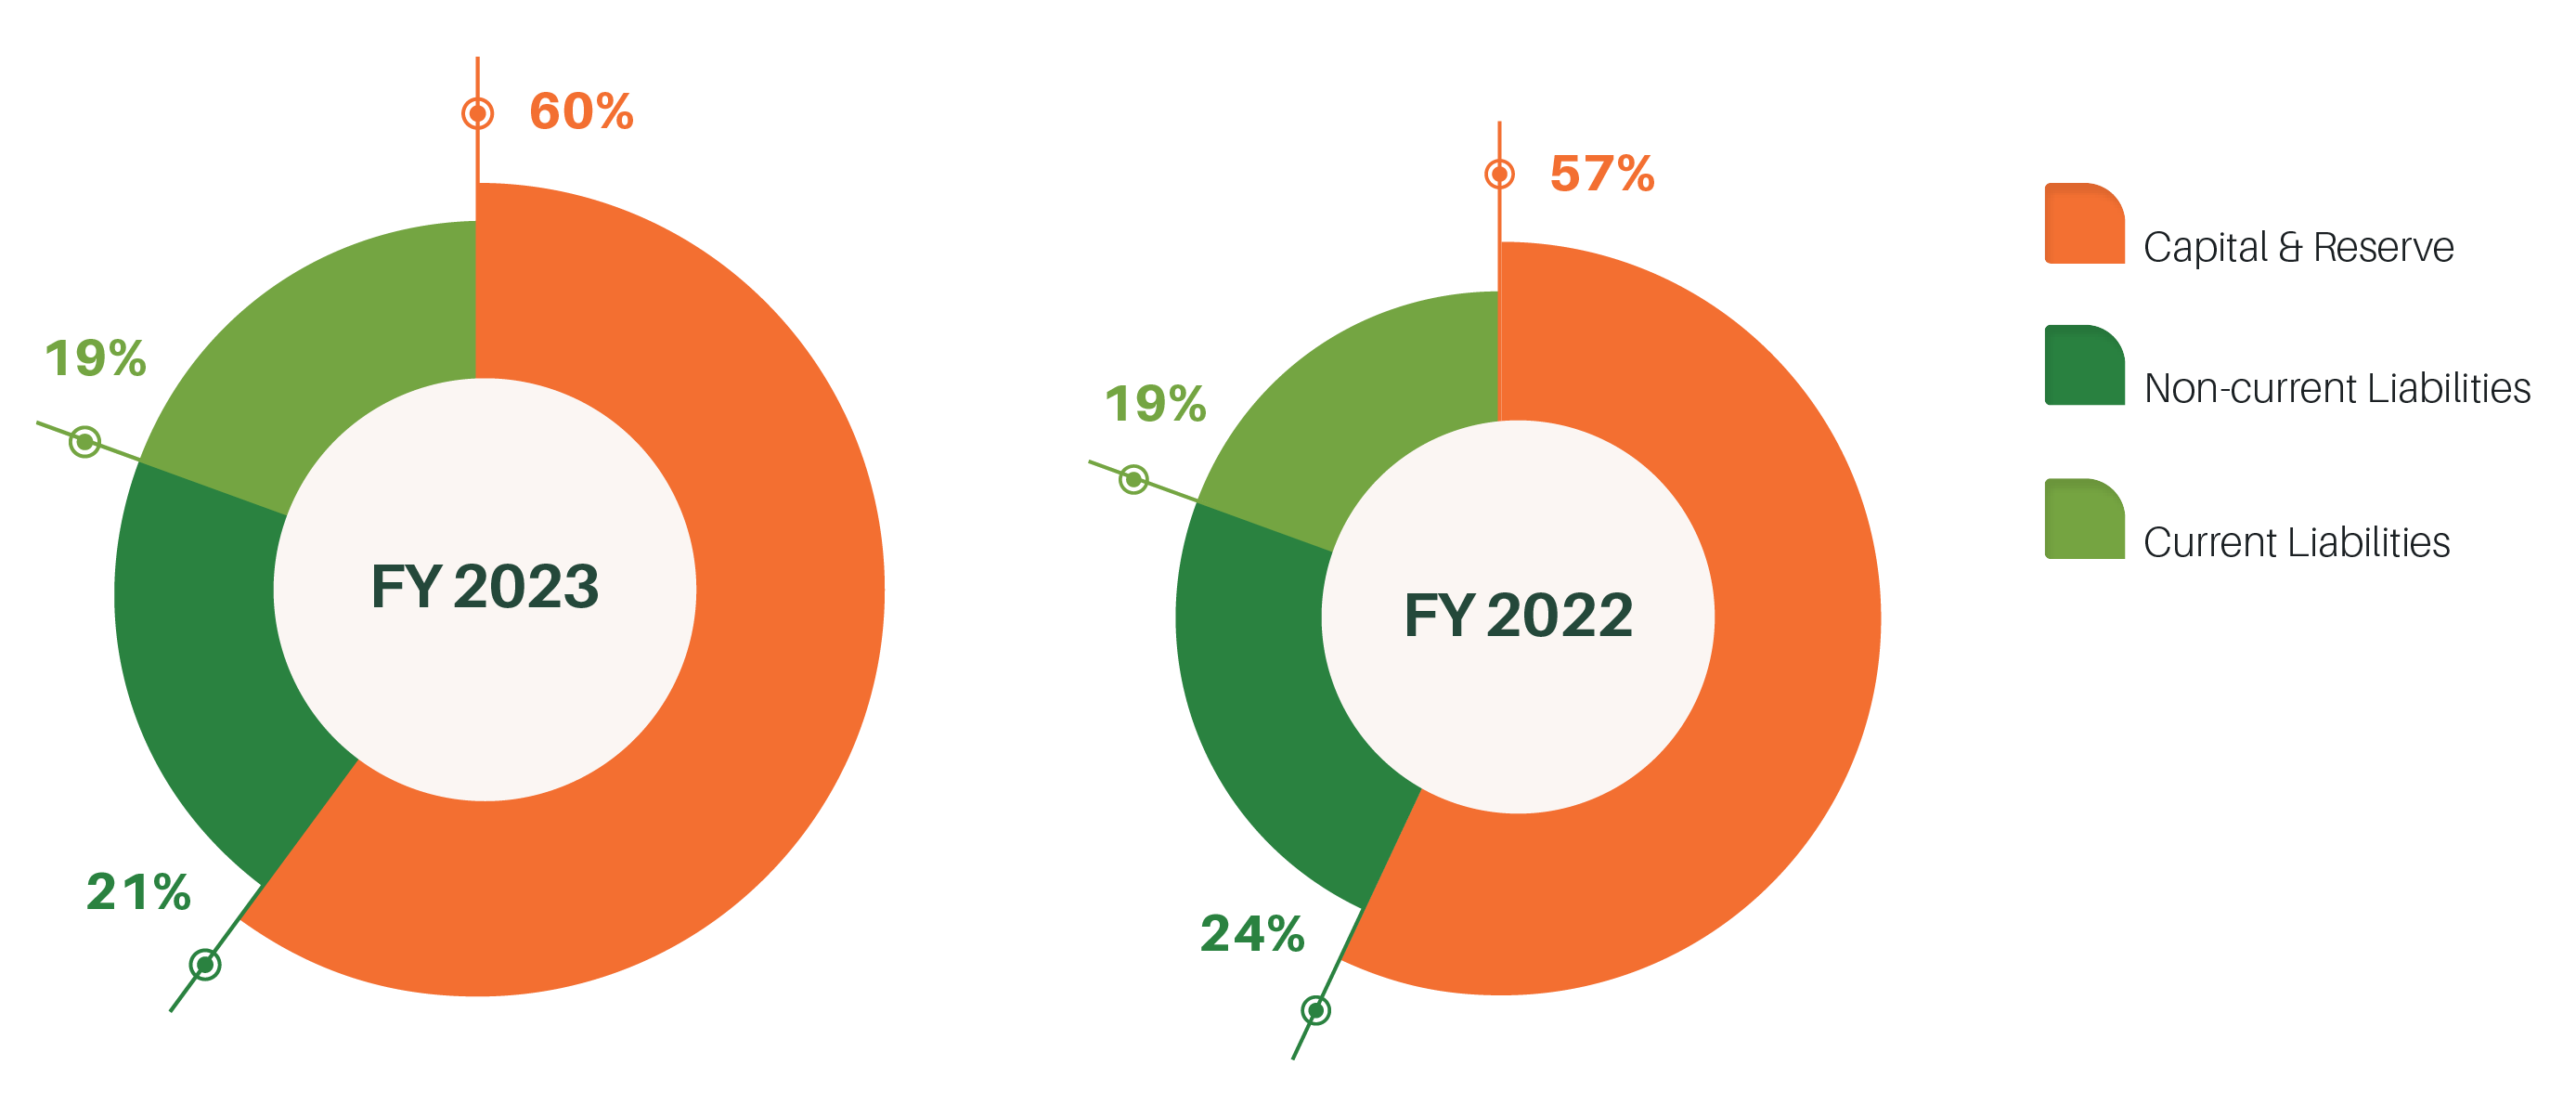
As at 31 March 2024, the Group's total assets stood at $669.52 million, an increase of 7% from last year. Non-current assets and current assets represent 29% and 71% of total assets respectively. Non-current assets consisted mainly of leasehold land and buildings and structures at Singapore Botanic Gardens and Fort Canning Park, as well as the structures at the Animal & Plant Health Centre, Animal Quarantine Centre and Animal Management Centre. Capital and reserve stood at $398.95 million, while non-current liabilities and current liabilities stood at $141.05 million and $129.52 million respectively.
| FY 2023 | FY 2022 | INCREASE/(DECREASE) | ||
|---|---|---|---|---|
| Assets | $ '000 | $ '000 | $ '000 | %Change |
| Non-current Assets | 196,522 | 206,869 | (10,337) | (5) |
| Current Assets | 472,996 | 420,173 | (1,158) | 13 |
| 669,518 | 627,032 | 42,486 | 7 | |
| FY 2023 | FY 2022 | INCREASE/(DECREASE) | ||
|---|---|---|---|---|
| equity & liabilities | $ '000 | $ '000 | $ '000 | %Change |
| Capital and Reserves | 398,954 | 360,394 | 38,560 | 11 |
| Non-current Liabilities | 141,045 | 149,015 | (7,970) | (5) |
| Current Liabilities | 129,519 | 117,623 | 11,896 | 10 |
| 669,518 | 627,032 | 42,486 | 7 | |